![]() The amusement industry is a fickle beast — trends can change, attendance numbers can fluctuate — all in a very short amount of time. Amusement and theme park attendance is one of the more telling indicators of those trends and changes. Consumers’ spending and travel habits can provide helpful insight to theme park and other attraction operators.
The amusement industry is a fickle beast — trends can change, attendance numbers can fluctuate — all in a very short amount of time. Amusement and theme park attendance is one of the more telling indicators of those trends and changes. Consumers’ spending and travel habits can provide helpful insight to theme park and other attraction operators.
One way to monitor theme park attendance across the industry is by reviewing the Themed Entertainment Association’s annual Global Attractions Attendance Report. Attendance numbers for parks are collected from a variety of sources, including “statistics furnished directly by the operators, historical numbers, financial reports, the investment banking community and local tourism organizations, among others.”
The report analyzes the global market as a whole as well focused studies on three main regions: the Americas, Europe and Asia.
To qualify for inclusion in the report, a park must be gated and requite a ticket for entry.
As expected, the newly released 2016 report contained some interesting findings:
1. Attendance declined by 1.1 percent from 2015 across the top 25 amusement and theme parks in the world (ranked by attendance).
The top 25 parks saw a combined attendance of 233.1 million in 2016 versus 235.6 million in 2015.
According to the report, this dip resulted from a number of anomalies that affected the Asian market.

“Harry Potter and the Forbidden Journey” thrill ride located within Hogwarts castle at “The Wizarding World of Harry Potter” at Universal Studios Hollywood
2. However, the top 10 theme park chains (ranked by total attendance) saw an attendance increase of 4.3 percent from 2015.
The top 10 theme park chains:
1. Disney
2. Merlin
3. Universal
4. OCT Parks (China)
5. Fantawild (China)
6. Six Flags
7. Chimelong (China)
8. Cedar Fair
9. SeaWorld Parks
10. Parques Reunidos
3. All Universal parks in the top 25 saw year-over-year attendance increases in 2016.
Universal Studios Hollywood saw an increase in nearly one million guests.
#4 – Universal Studios Japan: 4.3% (14.5M vs. 13.9M)
#9 – Universal Studios Florida: 4.3% (9.9M vs. 9.5M)
#10 – Islands of Adventure: 6.5% (9.3M vs. 8.7M)
#15 – Universal Studios Hollywood: 13.9% (8M vs. 7M)

Flight of the Hippogriff and Hogwarts castle at “The Wizarding World of Harry Potter” at Universal Studios Hollywood
Universal Studios Hollywood was the real winner, witnessing a nearly 14 percent increase in attendance. This jump likely resulted from the opening of the Wizarding World of Harry Potter and other attractions.
The addition of Harry Potter attractions and the Volcano Bay water park in Florida have likely helped (and will help) drive attendance through 2017.
4. Meanwhile, every Disney park in the top 25 saw a decrease in attendance from 2015 (excluding newcomer Shanghai Disneyland):

Magic Kingdom
#1 – Magic Kingdom: -0.5% (20.3M vs. 20.4M)
#2 – Disneyland: -1.8% (17.9M vs. 18.2M)
#3 – Tokyo Disneyland: -0.4% (16.5M vs. 16.6M)
#5 – Tokyo DisneySea: -1% (13.4M vs. 13.6M)
#6 – Epcot: -0.7% (11.71M vs. 11.79M)
#7 – Animal Kingdom: -0.7% (10.8M vs. 10.9M)
#8 – Hollywood Studios: -0.5% (10.7M vs. 10.8M)
#11 – California Adventure: -0.9% (9.2M vs. 9.3M)
#13 – Disneyland Paris: -14.2% (8.4M vs. 9.7M)
#17 – Hong Kong Disneyland: -10.3% (6.1M vs. 6.8M)
#22 – Walt Disney Studios Park at Disneyland Paris: -1.6% (4.9M vs. 5M)
Note: Disney allegedly does not report official numbers to TEA, which would make these numbers estimates.
Some of the dips are rather minuscule, but some are certainly eyebrow-raising.
Disney’s North American parks saw an average 1 percent decrease in attendance over 2015. However, Disney as a chain still ranks at the top in North America compared to growing rival Universal. And revenue increased by 5 percent at Disney’s North American parks thanks to increased guest spending, which the report attributes to:
- increased guest spending
- higher prices for theme park tickets and cruise bookings
- increased food, beverage and merchandise prices
- higher hotel room rates
It will be interesting to see if the opening of the Avatar-inspired Pandora land has any impact on Animal Kingdom’s numbers in the 2017 report.
5. Both Six Flags and Cedar Fair chains saw attendance increases in 2016.

Patriot at California’s Great America
In 2016, Six Flags saw a 5 percent increase in attendance and a 4 percent increase in revenue over 2015. The chain attributes these increases to increased season pass sales and higher ticket prices, respectively. Some of the parks in the chain experienced significant increases in attendance — each in the 5 percent range:
- Six Flags Great Adventure
- Six Flags Great America (top-20 newcomer)
- Six Flags Mexico
Cedar Fair as a whole saw a 2.7 percent increase in attendance over 2015 and increased revenue, likely due to season pass price restructuring and higher ticket prices.
6. Big data is a big deal.
Data is an invaluable asset to any business, and theme parks are no exception. As a data nerd, I really liked this line from the report:
It is a business maxim that it costs less to motivate existing customers to spend more, than to add new customers.
The report references Universal’s new Volcano Bay water park in Orlando, which features a “modern enterprise system with radio-frequency identification (RFID) functionality.
Note: read our MagicBands 101 article to learn more about how RFID is changing the amusement industry.
7. IPs are a big deal too.

Joker at Six Flags Great America
Intellectual properties (IP) play pivotal roles in the marketing of new and existing attractions. The report references Six Flags’ increasing usage of DC Comics properties in its attractions, such as the Joker 4D coasters that are opening at Six Flags parks across the nation. The Justice League dark rides also take advantage of both the timeless and current appeal of these superheroes as they take over the big screen.
8. Asia is taking the amusement industry by storm.
Asia, particularly China, saw incredible growth and success in 2016. And that growth shows no signs of slowing, with a slew of parks in development such as Universal Studios Beijing.

Shanghai Disneyland
Shanghai Disneyland officially opened and performed better than expected, debuting at the #21 spot on the list of the top 25 theme parks in the world with 5.6M guests visiting the park.
But there are a couple of concerning numbers in the region. Hong Kong Disneyland and Ocean Park both saw significant attendance declines in 2016: 10.3 percent and 18.8 percent, respectively. The report attributes these declines to a decreased level of tourists coming from Mainland China along with increased competition from other Chinese parks.
TEA forecasts that by the year 2020, attendance at Chinese theme parks will surpass attendance at U.S. parks.
9. Europe: patches of success.
While several of the top 20 parks in Europe saw attendance decline or remain stagnant, others saw increases in 2016.
Parque Warner in Madrid, Spain, saw an attendance increase of more than 9 percent thanks to a boost in tourism in the region. France’s Puy du Fou and Futuroscope parks both saw healthy increases as well. And in Germany, Phantasialand, Europa Park and Heide Park all saw attendance growth.
10. The new Dubai parks: wait and see.
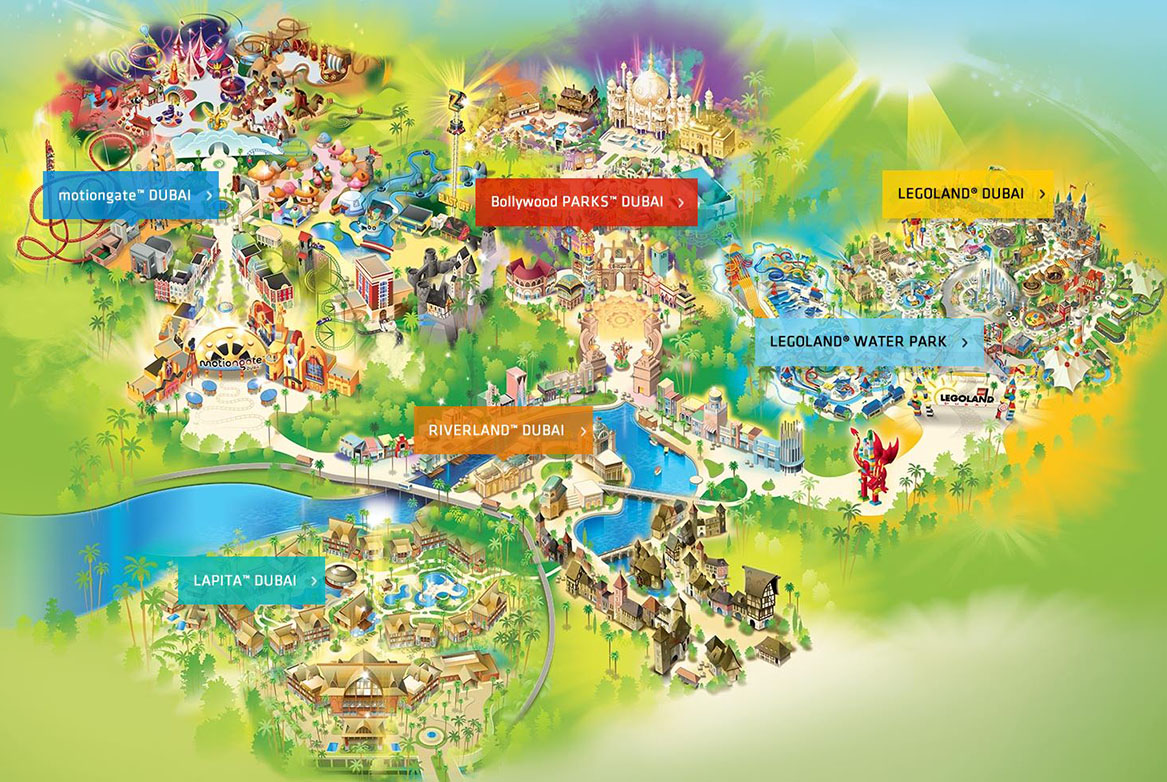
Dubai Parks & Resorts
The 2016 report does not include numbers from the new IMG Worlds of Adventure and Dubai Parks & Resorts. Industry leaders expect high numbers, but we will have to wait until next year to know exactly how these new parks perform.
View the full 2016 Global Attractions Attendance Report here.
What do you think about the theme park attendance trends and other findings in the 2016 report? Share your thoughts in the comments section below!


Recent Discussion