If you’re a fan of visiting the Disney parks, you’ve likely come across a website called TouringPlans.com, a one-stop-shop for all of your Disney vacation planning needs. You might have created a Touring Plan to help navigate your way around the parks, used their crowd calculator to determine the least busy days to visit the parks, or even found the perfect hotel room using their Walt Disney World Resort Guide.

Last month, we were able to connect with Len Testa, President of TouringPlans.com, and co-author of The Unofficial Guide to Walt Disney World, The Unofficial Guide to Disneyland, and The Unofficial Guide to British Theme Parks, to learn more about how TouringPlans got its start, how a Touring Plan “works,” and to learn more about this vital Disney vacation planning guide.
With the amount of information we took in during our conversation with Len, we’ve decided to break the interview up into multiple parts. A portion of the interview will be released on each Tuesday in August. Part two (today) will focus on Len’s background, and how the Touring Plans software got its start.
Part One (August 7): The Origins of TouringPlans
Part Three (August 21): TouringPlans.com Features
Part Four (August 28): Industry Trends
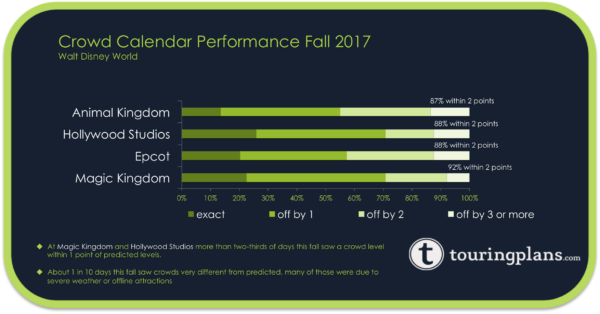
Coaster101.com: What kind of data does the crowd calendar use? What factors are taken into account where a random Wednesday in October, a park will have a 3/10 crowd rating, but the next day, the same park will be a 6/10.
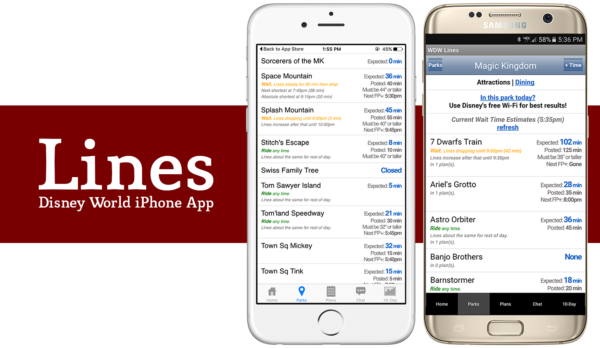
Len Testa: Here’s where that starts. Every day, we collect somewhere between 8,000 and 12,000 wait times from the parks. We have hundreds of thousands of paying subscribers, millions of users, we obviously have an app called Lines – and on that app, not only can users submit the posted wait times, they can post the actual wait time that they wait in line. We’re getting wait times from the users, looking at Disney’s API as well, and we have staff whose job it is to be in the parks every day. We’ve got people in Disney World, and Guy Selga in Disneyland, and their job is to not only collect the wait times, but also to notice unusual situations. So, if Guy sees that the posted wait for Space Mountain is 5 minutes, but the line’s out the door, his job is to get in line to time the actual line.

In addition to the wait time, we can catch up to 600 other individual pieces of data about that wait time that help us understand what’s driving the wait time. Park operating hours, day of week, day of month, month of year, weather, park operating schedules – was there extra magic hours today, are there extra magic hours tomorrow? Was it morning or evening? – school schedules for the 100 largest school systems east of the Mississippi River, so we know on any given day what percentage of those students are in school, and how far they are from Orlando, because obviously local school systems have more of an influence than ones that are further away. We track the economy of the United States, things like the Consumer Price Index as a logging indicator. The economic data is something we recently added. The people who are at Walt Disney World today, did not decide to go to the park today. They decided 3-6-9 months ago that this would be their summer vacation. They made this decision in the context of the economy 3, 6 or 9 months ago. What we want is the data around the time that they booked, and we look at this, and try to forecast it out going forward. We do that for the United States, Canada, the United Kingdom and Brazil.
We also look at things like sunrise and sunset. Sunset is interesting because we added it within the last 18 months, and what prompted us to do it was Kilimanjaro Safaris, when they started doing evening safaris. It’s going to sound obvious and work with me here – It turns out that sunset is a visual indicator that the day is coming to an end, and some people’s behavior changes when they see that. In the summer it’s obviously later, and the winter its obviously earlier. We discovered that sunset is very important for predicting wait times.
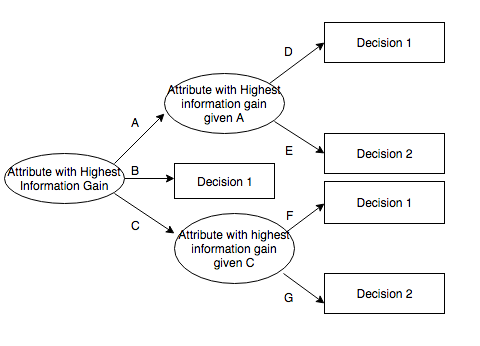
Part of the job that our statisticians – Fred and Steve – have is determining which of these 600 variables – what are the top 50 are contributing to wait times? We get those wait times, we run them through some machine learning algorithms that say on average over time, these are the things that look important. Extra magic hours are always there, school schedules are always in there – and then these are the things that don’t look as important. Once we have the list of things that are important, we try to forecast them out, for example, if the machine learning algorithm says Epcot has extra magic hours in the morning on Tuesday, it’s busier than normal. If we look at Disney’s published Extra Magic Hours and it’s got Tuesdays coming up, the algorithm will take that into account when it predicts and say that it will be a little busier on this day because of what we’ve seen in the past. It’s basically making a very large decision tree and trying to figure out the posted wait time from there.
Coaster101.com: In the simplest terms, how does the “algorithm” create a plan for you? How does it know the most efficient path (for time, not necessarily number of steps)?
Len Testa: It works like this. Imagine you had two Touring Plans, that were generated randomly. You just picked a random attraction to start with and went from there. Call those two things parents, mom and dad. You can merge those two plans together to make a child. So, let’s say for example, the two plans both had Pirates of the Caribbean first, Splash Mountain second, and then the “child” would also have Pirates first and Splash Mountain second. That’s how children inherit traits from their parents. What you do is calculate how long it takes that entire plan to work, and then you compare it to every other plan you’re currently look at. So, mom and dad, if this child is shorter in terms of time, then the child enters the population, and the other touring plan that takes longer, dies. The natural selection part of the whole thing. If the child is better than the current plan, it continues, and the other plan goes away. Over time, what that tends to do is improve the population. The population of Touring Plans gets better, and you start to see patterns emerge and sequences of rides emerge. And we give it 30-45 seconds, and it goes through billions of possibilities with fast computers, and we find one that works, that send it back. It’s very efficient.
Imagine you had three rides you wanted to ride. There’s 3 ways you can go for that first ride, then of the remaining rides, there’s two choices, and then, for the final ride, there’s one choice. 3x2x1, 6 choices. For 5, its 5x4x3x2x1, which is 120. For 10 rides, I’ll spare you the math, its 3.628 million different combinations. By the time you get to 20 rides, which is what we do for the Unofficial Guide TouringPlans, it’s like 2.43 quintillion. You can know Disney World as well as you want and can even throw out details like “You know not to go to Mad Tea Party first.” There’s no way in your head you’re going through several billion possibilities. You’re just not going to do it. It’s not the type of thing that humans have evolved to do, but computers are very good at it.
If you can frame the problem as a number crunching problem, then there’s no way people can compete with computers. What if you based your whole plan on “Let’s go to Space Mountain first?” What if Space Mountain’s down? Now what? Now your entire strategy is out the window. But for the computer, it’s like fine, I’ll go onto the next thing.
Coaster101.com: How can TouringPlans and the Lines app can accurately predict Disney ride lines as a third party but smaller regional parks can’t accurately measure their own?
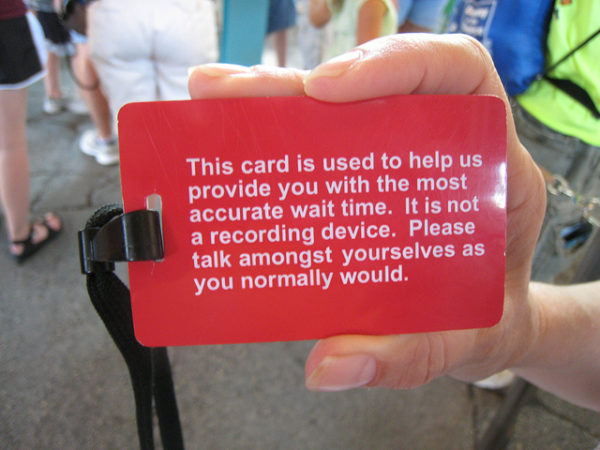
Len Testa: We were approached by another regional theme park company, I will not tell you which one, who asked us almost an almost identical question: how do you get these wait times? What it came down to was this: Whoever is running the theme park itself, the organization has to have the will to collect the wait times systematically and on an ongoing basis. For any organization, it means doing the equivalent of what the red flick cards are for Disney and posting those wait times, even if its manually, but posting them in a systematic way. That’s step one. That’s literally the first thing you have to do to do that, and if they haven’t thought of that, and I don’t know why they wouldn’t have, or if you don’t have the organizational will to do it, then you’re never going to get it done.
But if they’re willing to do that, you can see where everything else goes from that point. Once you have a reasonably accurate wait time, you can literally ask your users to time the wait in line and send you back the data. We built and app that does that, I’m sure other parks can do the same. I think the key for us was giving the users something to begin with, and then telling them “help us make this better.” We’re all a community here. Theme park people are a community We’ve always looked at this as “we’ll donate something to the community first,” and then we’ll ask for help. We’ve done with TouringPlans, we’ve done it with our Wait Times, we’ve done it with our hotel room photos, it’s all worked out really well. If you’re a regional park reading this, that’s what you should do. Invest in some interns to help get semi-accurate timings and then ask your users to help as well.
Thanks for reading! Come back next week as we discuss some of the features of TouringPlans.com!
For more information about Len Testa and Touring Plans, be sure to visit TouringPlans.com. You can also follow Touring Plans on Social Media: Facebook | Twitter | Instagram, and Len Testa on Twitter at @LenTesta.


Recent Discussion