Many coaster enthusiasts, including myself, like to keep track of all of the roller coasters they have ridden. Some websites allow you to do this, but you have to adhere to their rules and format. I decided to make my own track record in Microsoft Excel. I love looking at numbers and data so by creating my own spreadsheet I can look at the list of all of the roller coaster I have ridden along with several statistics, such as height, speed, length, and inversions. This is my explanation of how I made it and I encourage you to make your own.

The first thing I did was list all of the amusement parks I have visited that I could remember. This is placed on a sheet in the workbook that I called the “Master List” because, well, it contains all of the master lists used later on. In the next column I listed all fifty states. The next category is type of coaster- wood or steel. I also decided to make up a class type and finally, I listed all the roller coaster manufacturers I came across while looking up data on rcdb.com.
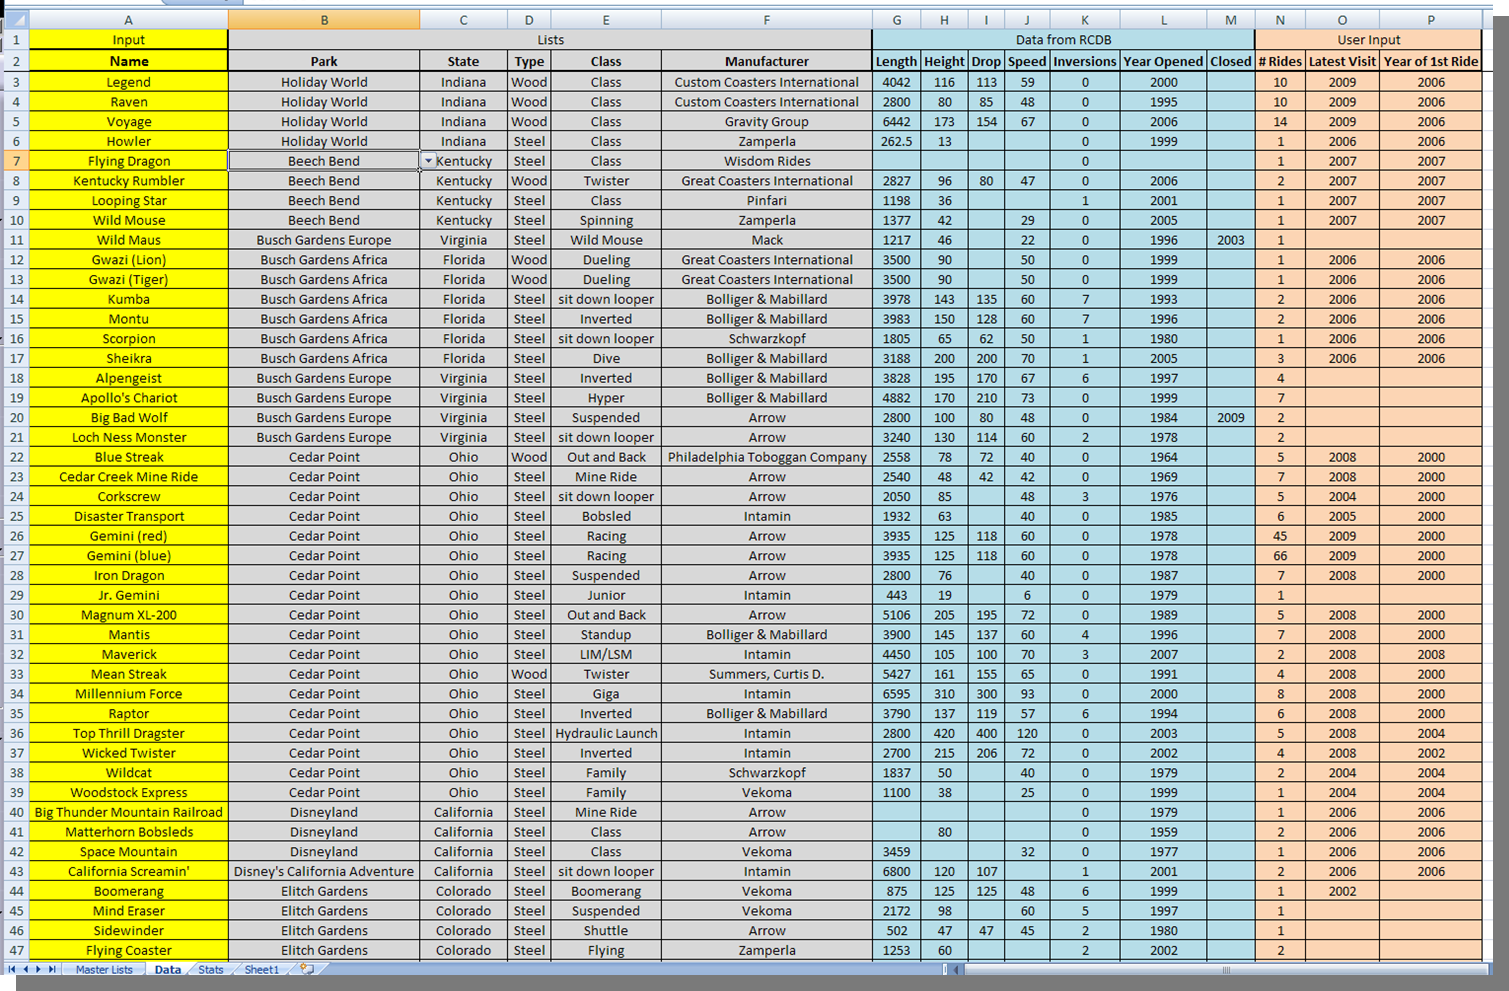
The next sheet of the workbook is where all of the individual coasters that I have ridden are listed. The first column is the name of the coaster, inputted by me. Under column B is listed the park where the coaster resides. Now for these entries you simply have to pick the name of the park on a drop down list which is generated from the first sheet. The same goes for the state, type, class, and manufacturer. I use drop down lists so you don’t have to do a lot of typing or copy and pasting. It reduces possible error which makes the final data more accurate.
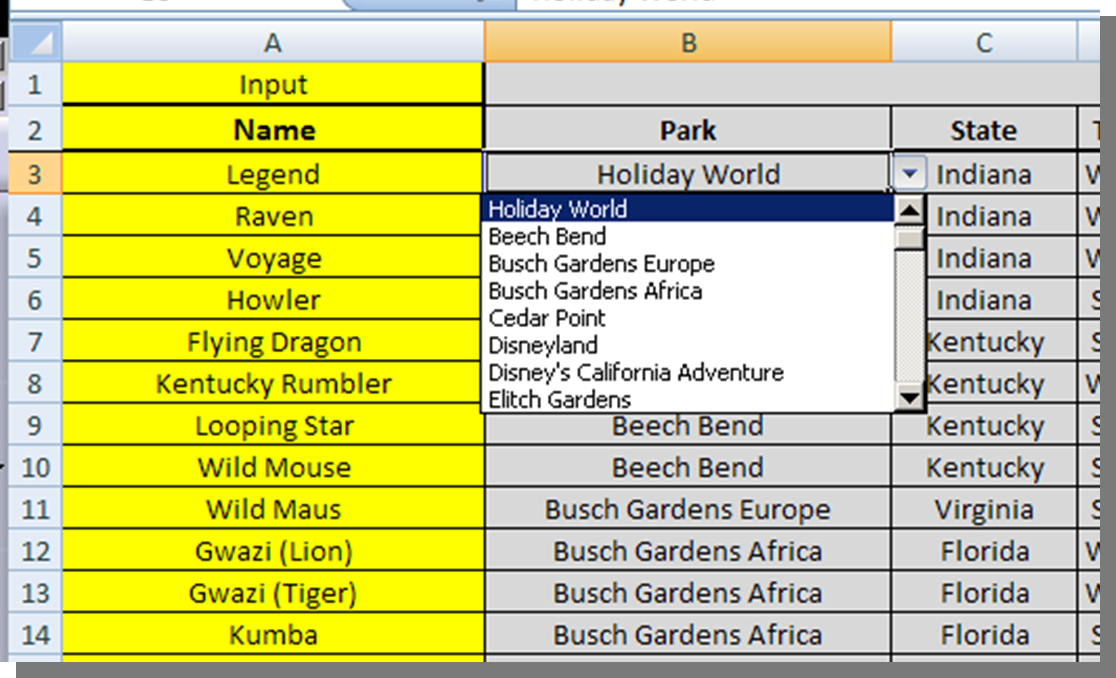
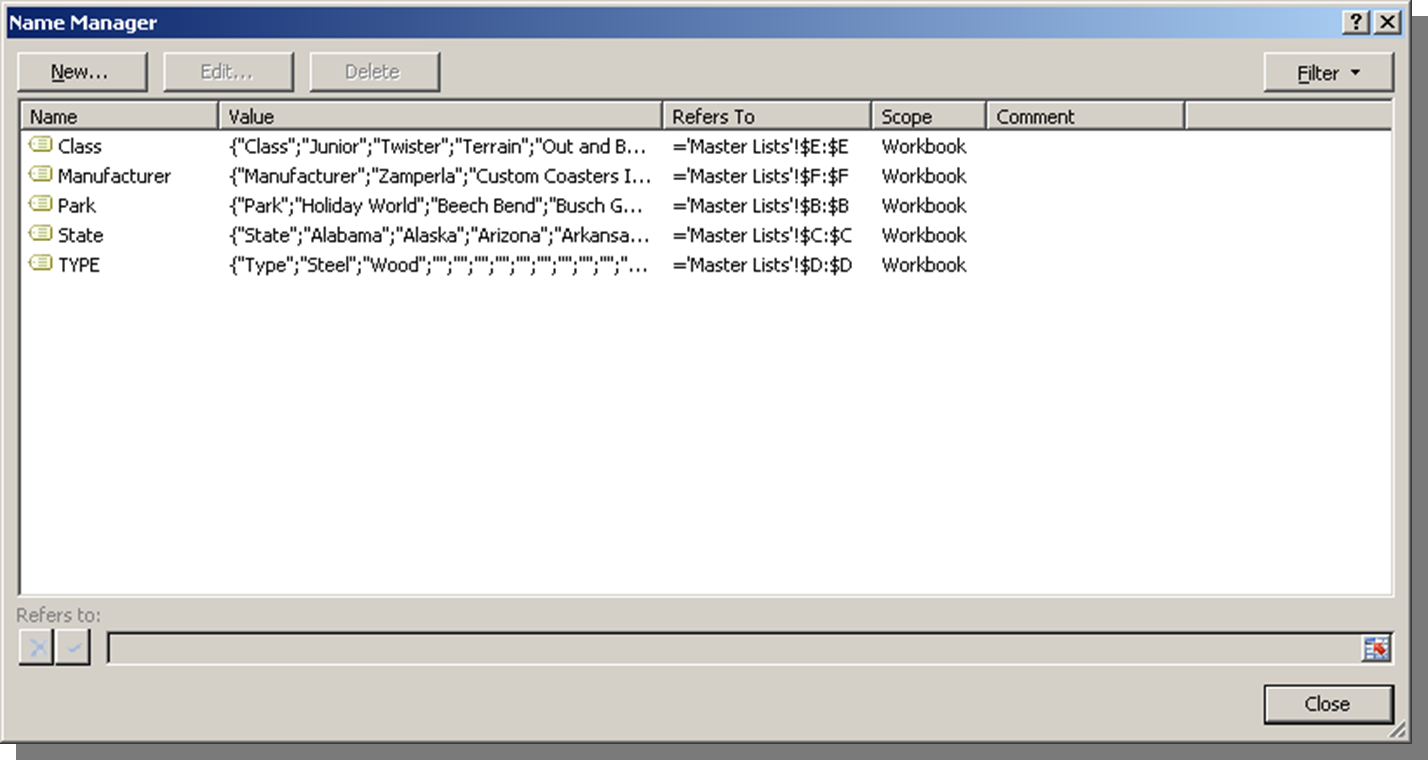
How do you create the drop down lists in Excel? You simply use the name manager to name your lists and then use data validation to actually change the cell from default to a list. Here are two quick pictures. If you need further explanation go here.

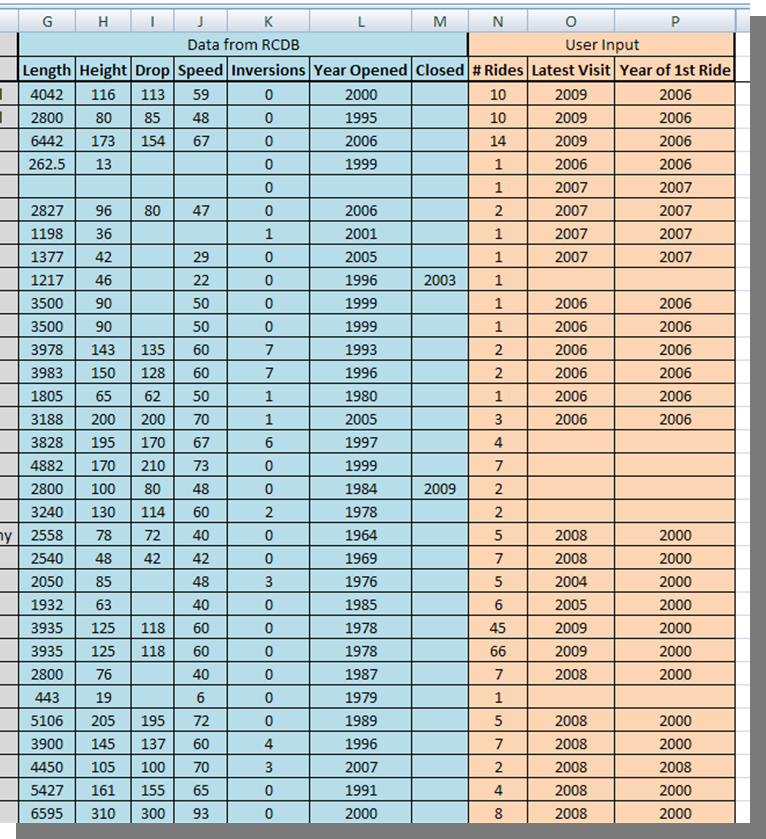
The last section is where the user needs to input their own data. I decided to list the number of times I have been on the ride, when my first ride was, and the last year it was that I rode. This section isn’t necessarily but I thought it would be fun to look at.
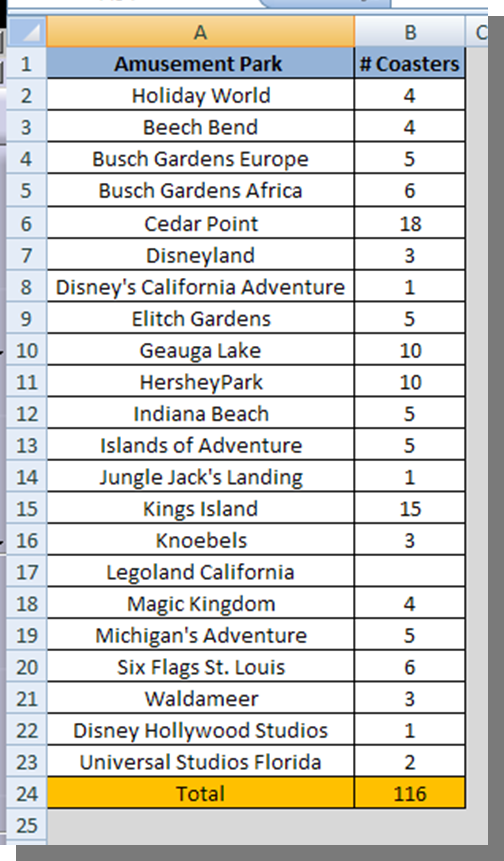
Now it’s time to take a look at the data, which I placed on the third sheet. In the first column I have called up the list of visited amusement parks from the Master List tab by using the formula =’Master Lists’!B2. The next column I have is to compute the number of roller coasters I have been on at each amusement park. I used this formula:
=IF(COUNTIF(Data!B:B, Stats!A2)=0, “”, COUNTIF(Data!B:B, Stats!A2))
which basically looks up the park listed in the first column, for example “Holiday World” and it goes through the column B in the Data sheet (the park column) and counts how many roller coasters are associated with that park, Holiday World. In this case, I have been on four roller coasters at Holiday World (Voyage, Raven, Legend, and Howler).
As you can see, Cedar Point is the park I have visited with the most coasters, 18 (I counted Gemini as two separate rides. Some would argue this point but when you make up your own track record you make up your own rules!) You can also see I visited Legoland California but did not ride any of the coasters. They looked far too scary!
I used the same formulas for the next section, the states. I’ve been on coasters in ten different states. Ohio had by far the most coasters with 44, which should also come as no surprise since I lived there for 23 years and it had three great parks. Florida comes in second with 18 and PA close behind with 16. The total number of coasters is 116. This is a good place to double check your work. If your total number comes out the same here as in the first section everything is fine, but if your totals don’t match up then there is a problem somewhere. Go back and double check all of your formulas.
Next is the type of coaster. 70% of the coaster I have ridden have been steel versus 30% wood structure.
Next is our classes and manufacturer’s data. I’ve been on 20 roller coaster built by Arrow Dynamics, which is no surprise because they were THE coaster company for a good number of years. Next is Vekoma and B&M.

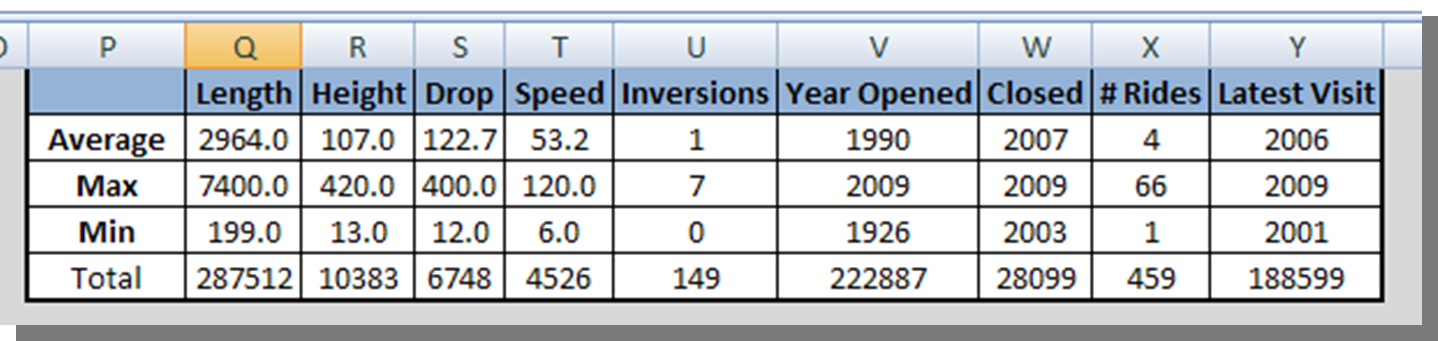
Now we get to the actual statistics. By listing all of the lengths for each coaster I can come up with an average, max, and min.
These formulas are quite simple: =AVERAGE(Data!G3:G201), =MAX(Data!G3:G201), =MIN(Data!G3:G201).
The average length of a coaster is 2964 feet, height is 107, drop is 122.7’, speed is 53.2, and goes upside down one time. I’ve traveled over 54 miles on different roller coasters! The Beast was the longest coaster and Top Thrill Dragster was the tallest and fastest. Any guesses as to what was the shortest?
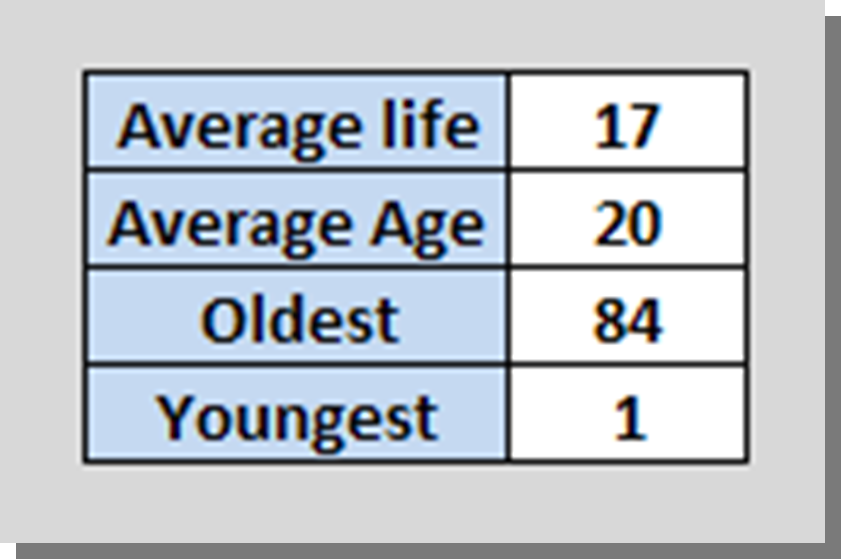
Another interesting stat to look at is average age versus average life of a coaster. The average life of a coaster is how long it actually exists. To get this number I took the average year a coaster was closed and subtracted the average year opened to get 17. This is only for rides that have actually closed and been torn down for good. The average age is this year minus the average year opened. The average age of coasters I have ridden is 20. When one of these rides closes it will bring up the average life statistic. The oldest coaster I rode was the Big Dipper at the now defunct Geauga Lake.
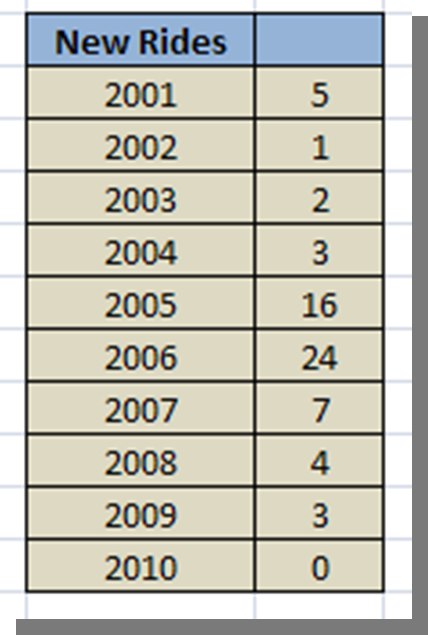
One final section to look at is the number of new rides I’ve visited each year. The formula I used is =COUNTIF(Data!P:P, V23) which counts the number of rides if the years match up. As you can see, 2006 was a great year with 24 new rides. The past two years have been a little disappointing in that regard but here’s hoping for a great 2010!
What other data would you like to see looked at or examined? Please share your thoughts or suggestions in the comments or in our forums!
For more Excel template examples be sure to check out my Excel Spreadsheet Help blog.


Recent Discussion